Data Warehousing and OLAP

Data Science 310

Boston University

Data Warehousing and OLAP Technology

Outline

  • What is a data warehouse? What is OLAP?
  • The Multidimensional Data Model
  • Implementation of Data Cubes
  • Designing a Data Warehouse

What is a Data Warehouse?

  • A data warehouse is a decision support database that is maintained separately from the organization’s operational database
    • Operational database: personnel / payroll, accounts payable, accounts receivable, orders, inventory, …
    • Data warehouse: none of the above
  • Supports information processing by providing a solid platform of consolidated, historical data for analysis
  • “A data warehouse is a subject-oriented, integrated, time-variant, and nonvolatile collection of data in support of management’s decision-making process.” – W.H. Inmon

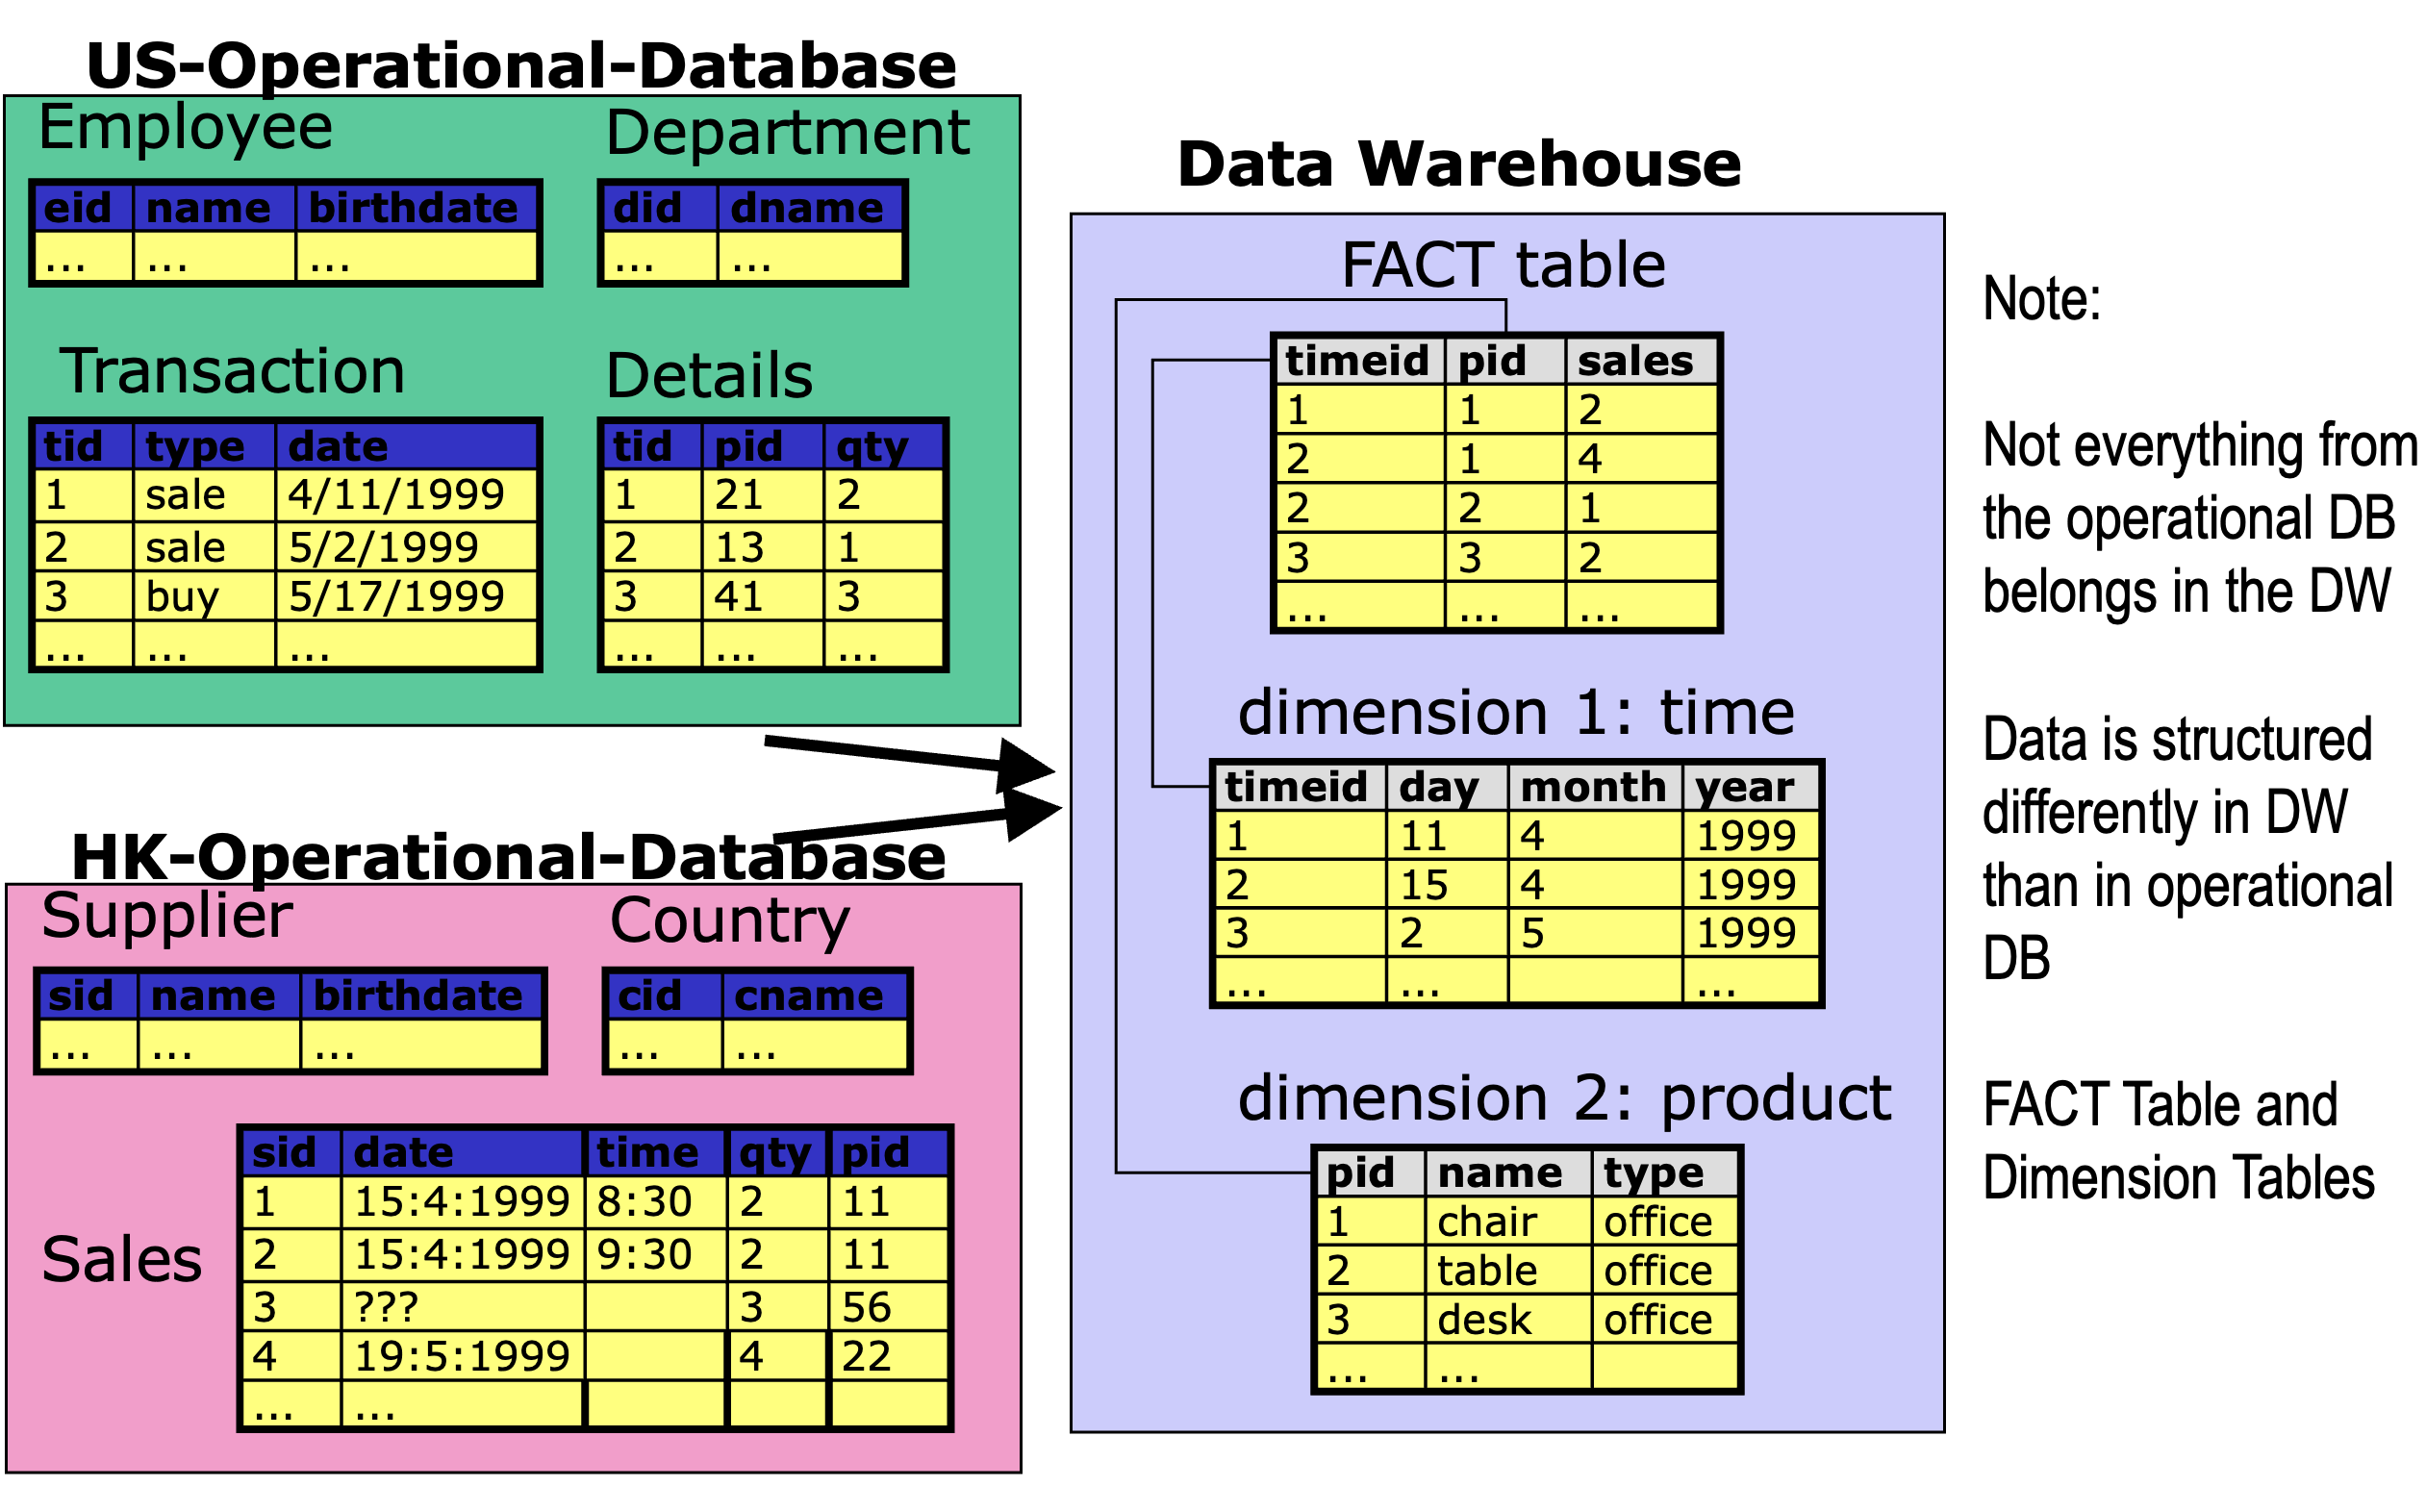
Example of a Data Warehouse

A Data Warehouse is Subject-Oriented

  • Organized around major subjects, such as customer, product, sales
  • Focuses on the modeling and analysis of data for decision makers, not on daily operations or transaction processing
  • Provides a simple and concise view around particular subject issues by excluding data that are not useful in the decision support process

A Data Warehouse is Integrated

  • Constructed by integrating heterogeneous data sources
    • relational databases, flat files, on-line transaction records
  • Data cleaning and data integration techniques are applied.
    • Ensures consistency in naming conventions, encoding structures, attribute measures, etc. among different data sources
    • E.g., Hotel price: currency, tax, breakfast covered, etc.
  • When data is moved to the warehouse, it is converted.

A Data Warehouse is Time-Variant

  • The time horizon for the data warehouse is significantly longer than that of operational systems.
    • Operational database: holds current value data.
    • Data warehouse: provides information from a historical perspective (e.g., past 5-10 years)
  • Every key structure in the data warehouse contains an element of time, explicitly or implicitly
    • Note however that the keys used in operational data may or may not include a time element.

A Data Warehouse is Non-Volatile

  • The DW provides a physically separate store of data transformed from the operational environment
  • Operational update of data does not occur in the data warehouse environment
    • Does not require transaction processing, recovery, and concurrency control mechanisms
    • Requires only two basic classes of operations:
      • initial data loading and data access.

How is Data Loaded into a Data Warehouse?
Populating a Data Warehouse

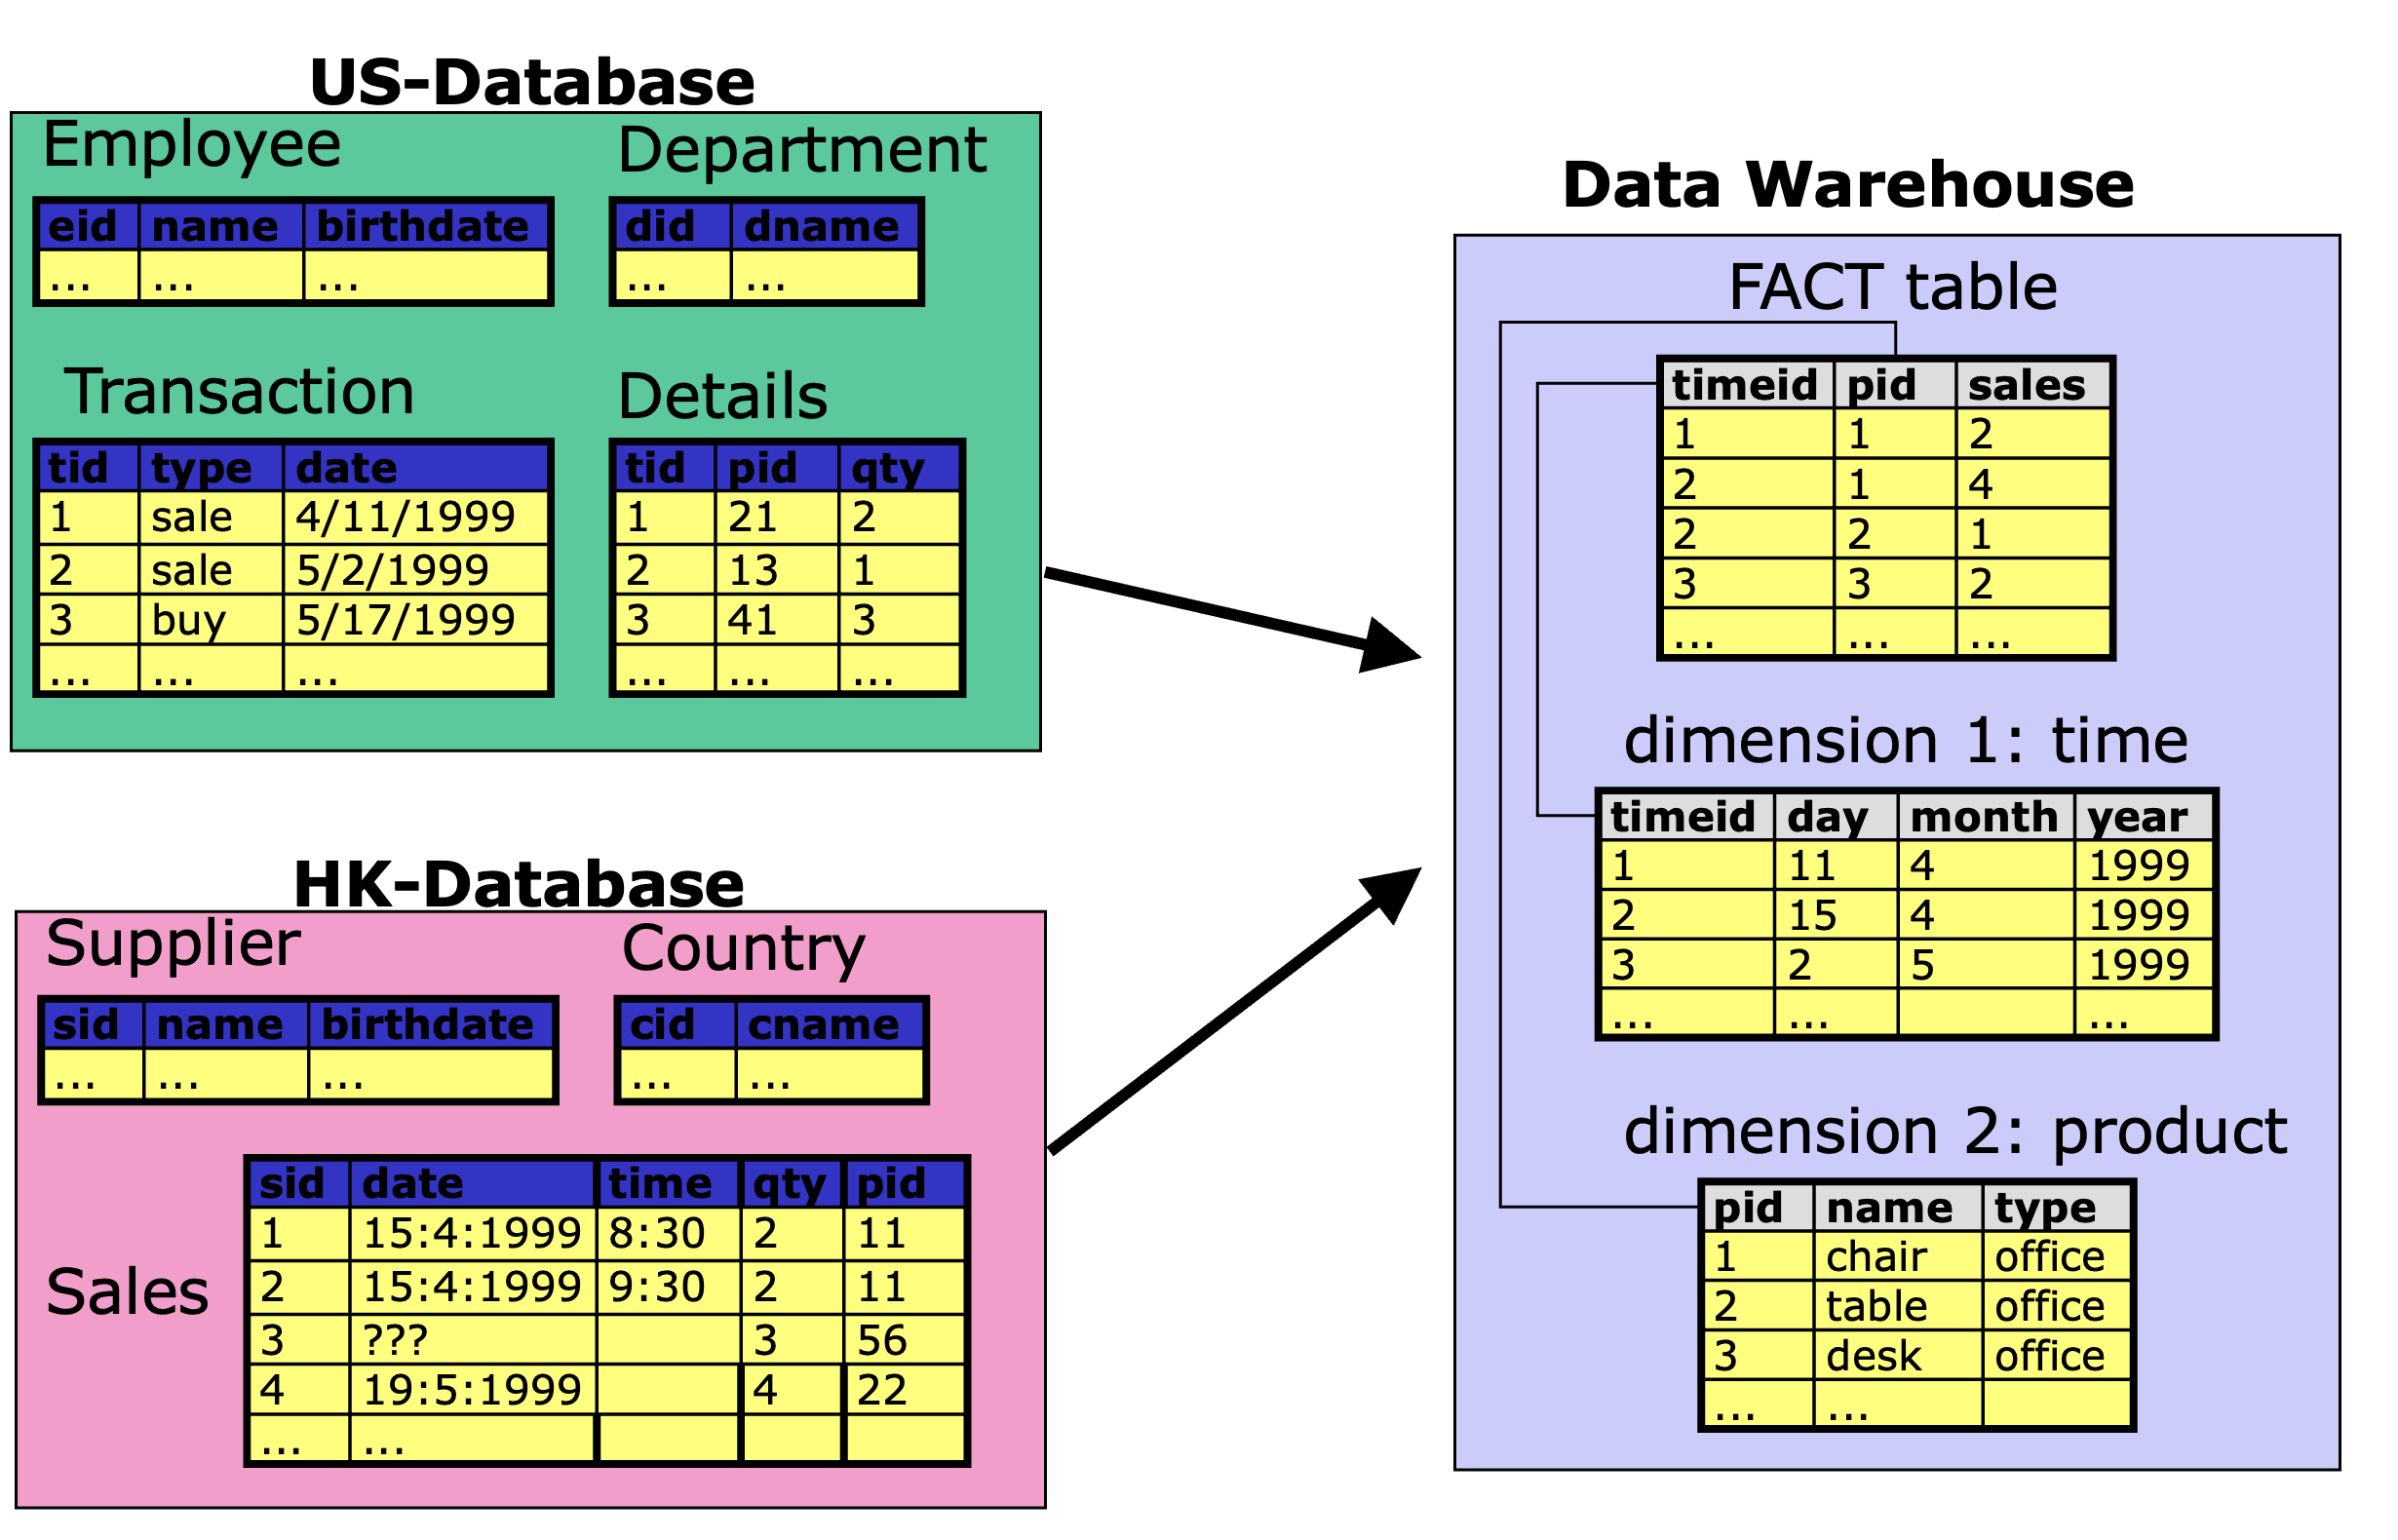
  • Data Selection
    • Only data which are important for analysis are selected
      • e.g., information about employees, departments, etc. are not stored in the warehouse
    • Therefore the data warehouse is subject-oriented
  • Data Integration
    • Consistency of attribute names
    • Consistency of attribute data types
      • e.g., dates are converted to a consistent format
    • Consistency of values
      • e.g., product-ids are converted to correspond to the same products from both sources
    • Integration of data
      • e.g, data from both sources are integrated into the warehouse

Populating a Data Warehouse (2)

  • Data Cleaning
    • Tuples which are incomplete or logically inconsistent are cleaned
  • Data Summarization
    • Values are summarized according to the desired level of analysis
    • For example, HK database records the time that a sales transaction takes place, but the most detailed time unit we are interested in for analysis is the day.

Data Warehouses Support OLAP

  • OLAP: On-Line Analytical Processing
    • Support for decision making
    • Typically involves aggregate operations
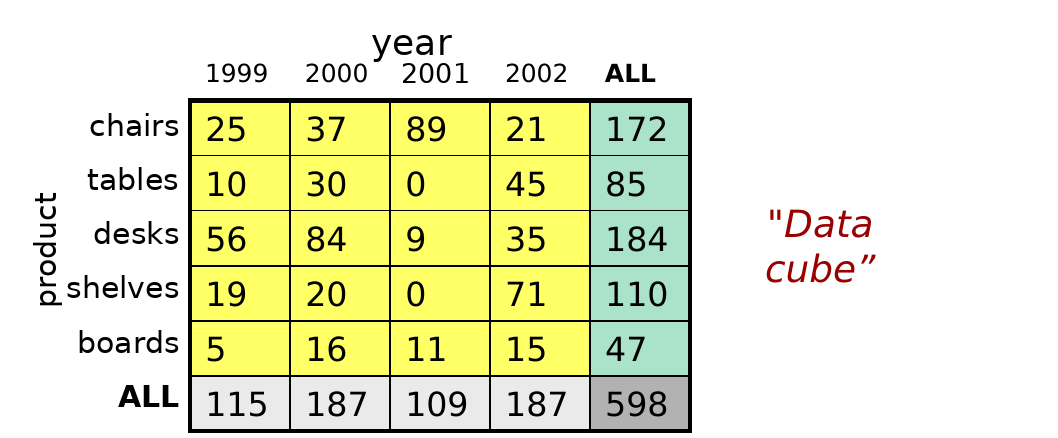
  • Example of an OLAP query (collects counts)
    • Summarize all company sales according to product and year, and further aggregate on each of these dimensions.
Data Warehouse vs. Operational DBMS

  • OLTP (on-line transaction processing)
    • Major task of traditional relational DBMS
    • Day-to-day operations: purchasing, inventory, banking, manufacturing, payroll, registration, accounting, etc.
  • OLAP (on-line analytical processing)
    • Major task of data warehouse system
    • Data analysis and decision making
  • Distinct features (OLTP vs. OLAP):
    • User and system orientation: customer vs. market
    • Data contents: current, detailed vs. historical, consolidated
    • Database design: ER + application vs. star + subject
    • View: current, local vs. evolutionary, integrated
    • Access patterns: update vs. read-only but complex queries

OLTP vs. OLAP

OLTP OLAP
users clerk, IT professional knowledge worker
function day to day operations decision support
DB design application-oriented subject-oriented
data current, up-to-date; detailed, flat relational; isolated historical; summarized, multidimensional; integrated, consolidated
usage repetitive ad-hoc
access read/write; index/hash on prim. key lots of scans
unit of work short, simple transaction complex query
# records accessed tens millions
#users thousands hundreds
DB size 100MB-GB 100GB-TB
metric transaction throughput query throughput, response

Data Warehouse Usage

  • Three kinds of data warehouse applications
  • Information processing
    • supports querying, basic statistical analysis, and reporting using crosstabs, tables, charts and graphs
  • Analytical processing
    • multidimensional analysis of data warehouse data
    • supports basic OLAP operations, slice-dice, drilling, pivoting
  • Data mining
    • knowledge discovery from hidden patterns
    • supports associations, constructing analytical models, performing classification and prediction, and presenting the mining results using visualization tools.

Why Create a Separate Data Warehouse?

  • High performance for both systems
    • DBMS— tuned for OLTP: access methods, indexing, concurrency control, recovery
    • Warehouse—tuned for OLAP: complex OLAP queries, multidimensional view, consolidation.
  • Different functions and different data:
    • missing data: Decision support requires historical data which operational DBs do not typically maintain
    • data consolidation: Decision support requires consolidation (aggregation, summarization) of data from heterogeneous sources
    • data quality: different sources typically use inconsistent data representations, codes and formats which have to be reconciled

Data Warehousing and OLAP Technology

Outline

  • What is a data warehouse? What is OLAP?
  • The Multidimensional Data Model
  • Implementation of Data Cubes
  • Designing a Data Warehouse

From Tables to Data Cubes

  • A dimension is a perspective with respect to which we analyze the data
  • A multidimensional data model is usually organized around a central theme (e.g., sales). Numerical measures on this theme are called facts, and they are used to analyze the relationships between the dimensions
  • Example:
    • Central theme: sales
    • Dimensions: item, customer, time, location, supplier, etc.

From Tables to Data Cubes (cont.)

  • A data warehouse is based on a multidimensional data model which views data in the form of a data cube
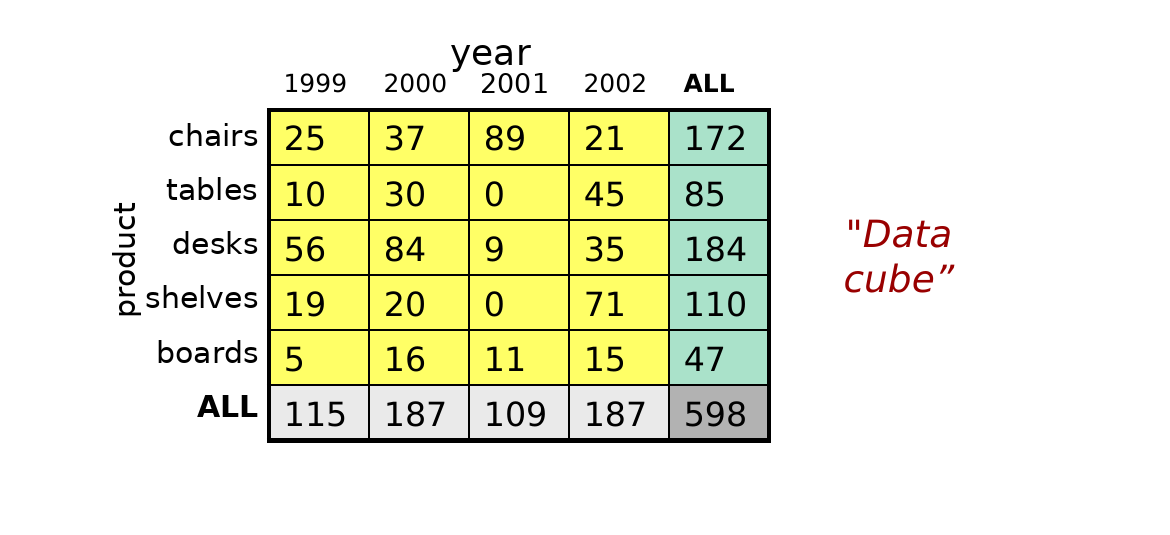
  • The data cube
    • summarizes the measure with respect to a set of dimensions
    • provides summarizations for all subsets of dimensions

From Tables to Data Cubes (cont.)

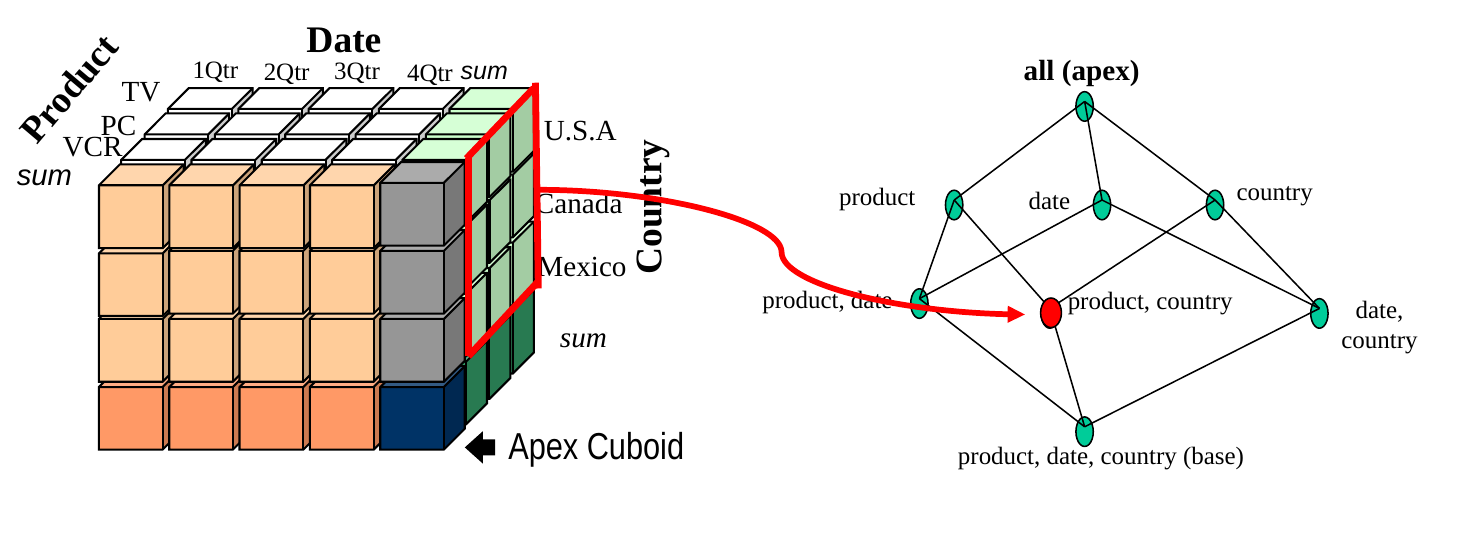
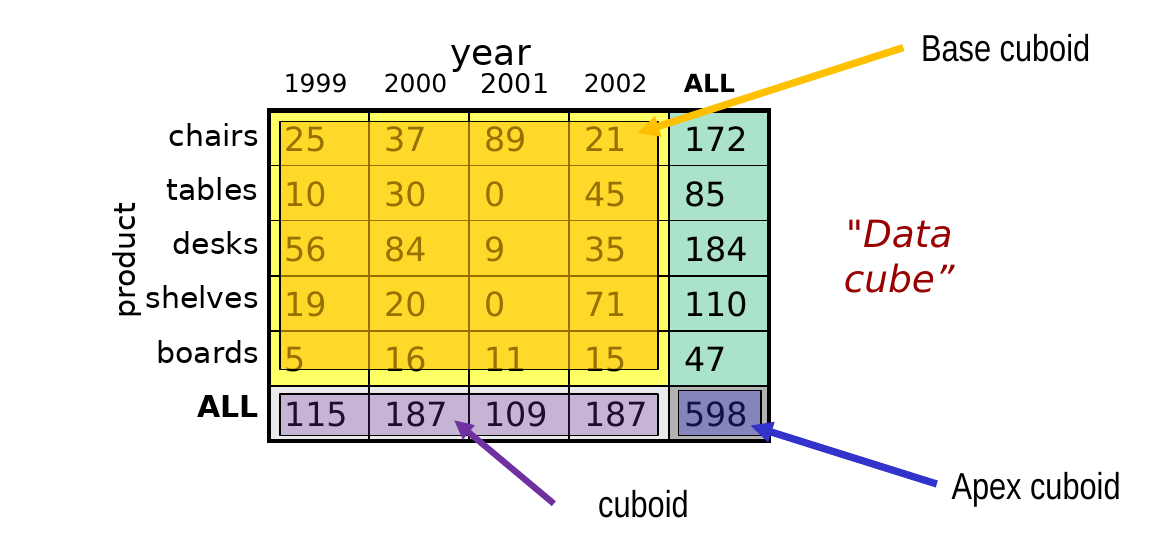
  • Summarizations along different dimensions are called cuboids
  • The most detailed part of the cube is called the base cuboid
  • The highest level of summarization is called the apex cuboid
  • The collection of cuboids forms a lattice (explained later)
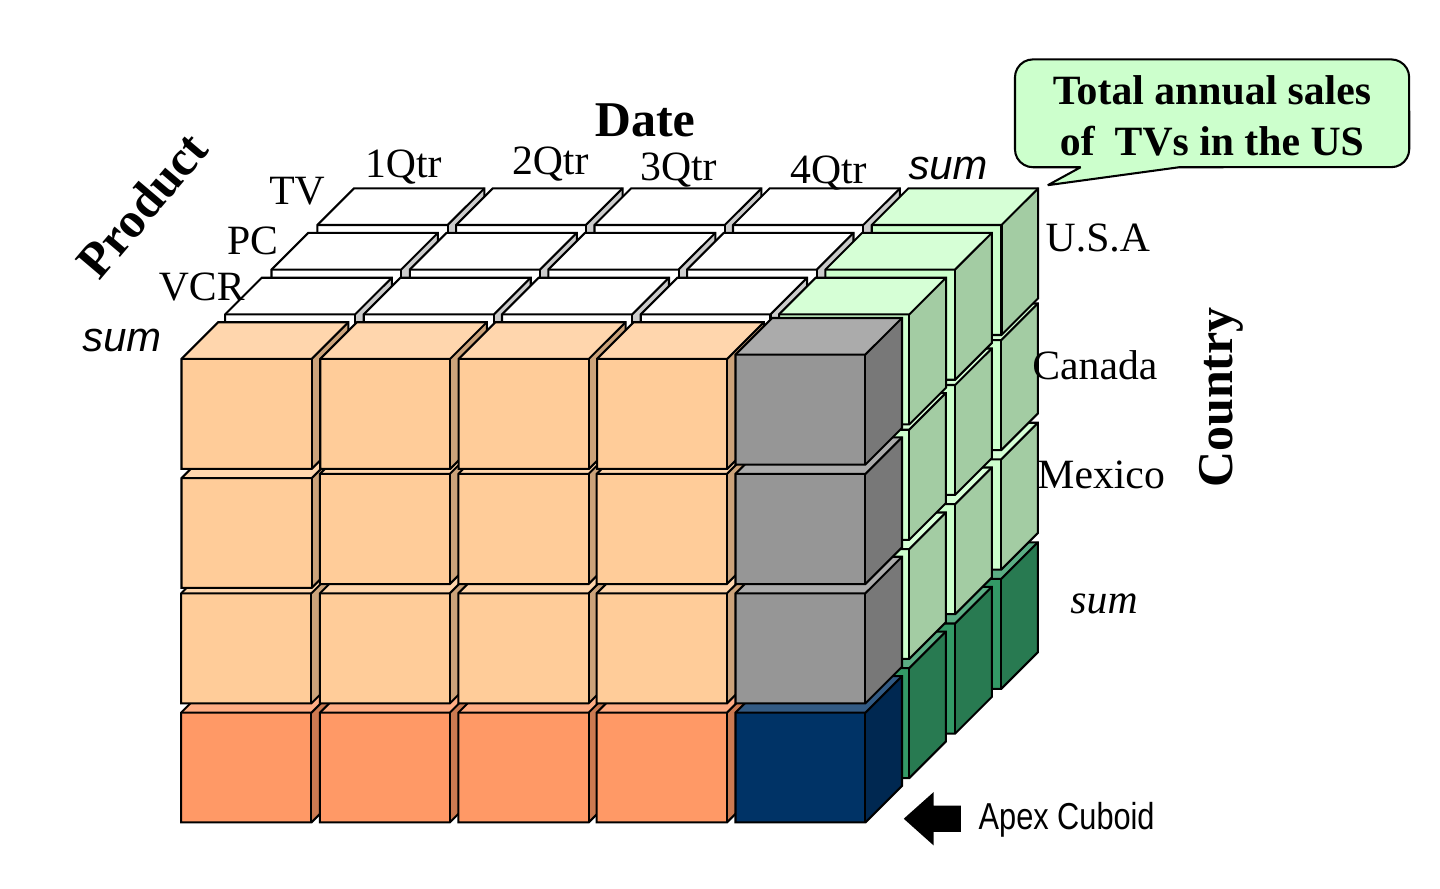
A 3D Data Cube
Data Cube is the Model, not the Implementation!

  • The implementation of this data model does not use a “cube” like data structure
  • A data cube, such as sales, is instead implemented using two types of tables:
  • Dimension tables
    • such as item (item_name, brand, type),
    • or time (day, week, month, quarter, year)
  • Fact tables, which contain:
    • measures such as dollars_sold, and
    • foreign keys to each of the related dimension tables

Implementing Cubes Using Tables

  • The most basic kind of data warehouse uses a star schema
  • A star schema has a fact table “in the middle” connected to a set of dimension tables

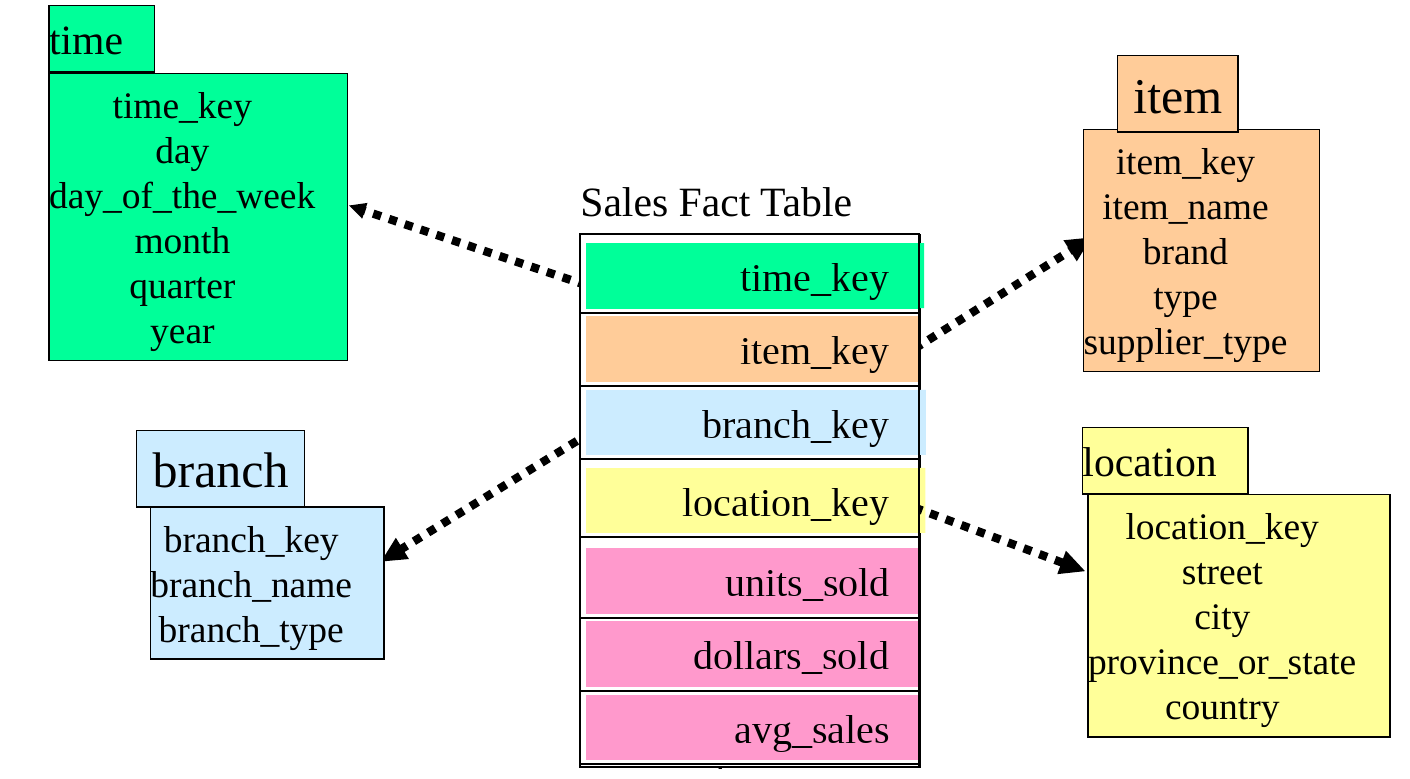
Example of a Star Schema

  • In this data cube, there is one fact table and four dimension tables
    • This is a four-dimensional data cube
  • The theme in this cube is sales
  • The measures in this cube are: units_sold, dollars_sold, avg_sales

Normalization leads to Snowflakes

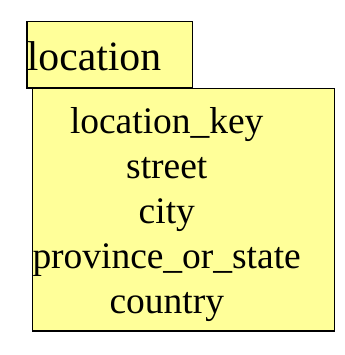
  • Notice that in this example, some dimension tables are not normalized
    • e.g., “province/state” is a function of city
    • “country” is a function of city
    • “supplier type” is a function of supplier
    • We should normalize these!

  • Snowflake schema: A refinement of star schema where some dimensional hierarchy is normalized into a set of smaller dimension tables, forming a shape similar to a snowflake

Example of a Snowflake Schema
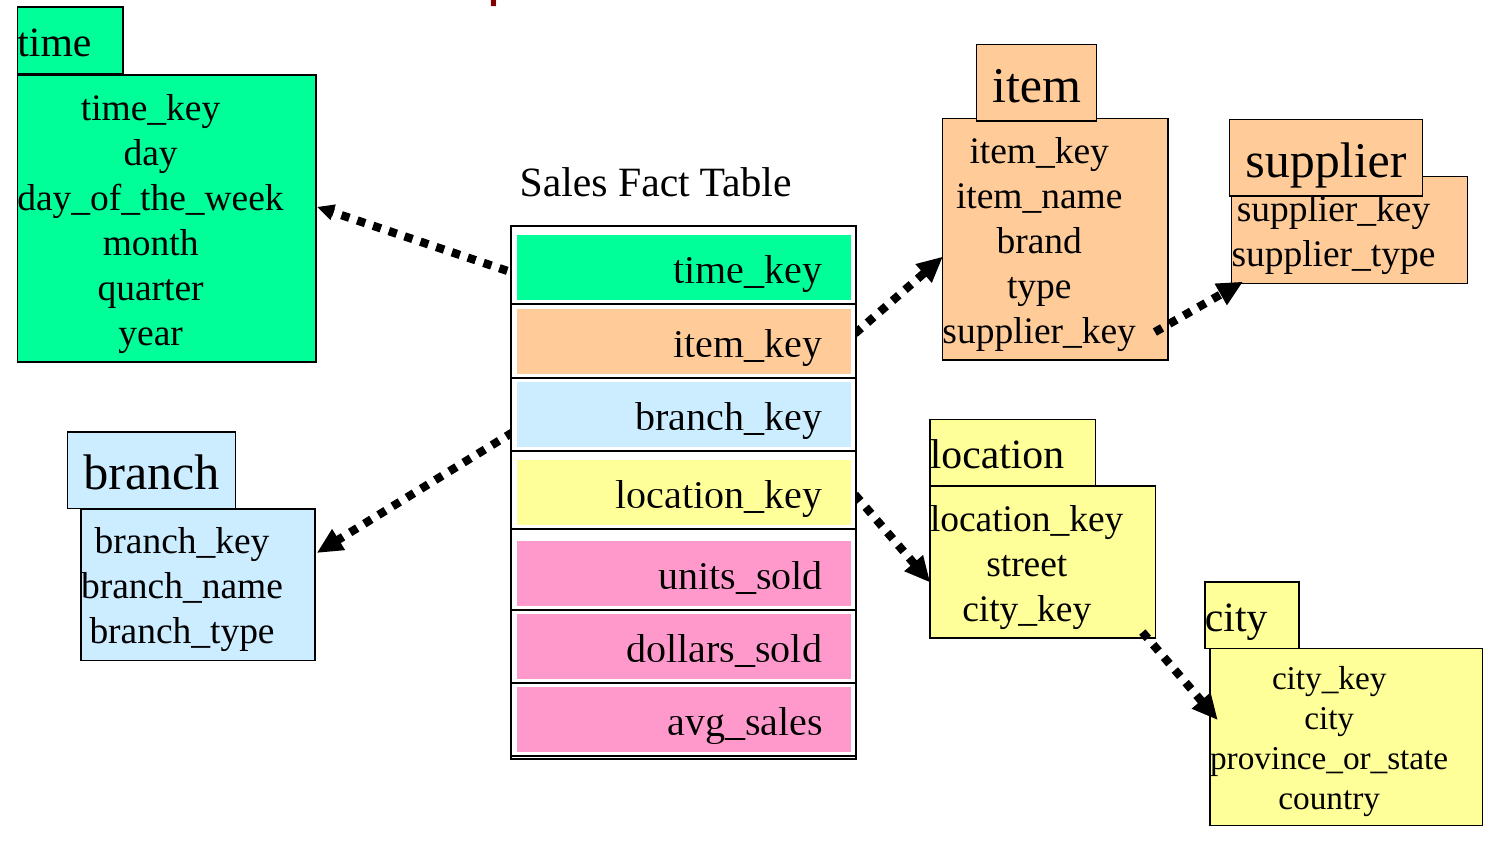
  • Normalizing the Star creates a Snowflake
    • Here: ‘item’ and ‘location’ have been normalized

Multiple Fact Types Leads to Constellations

  • Next, we might consider how the data warehouse would be extended to include multiple fact types
    • eg, could add a theme around “shipments”
  • Shipments might share some dimension with sales
    • eg, location, time, item
  • So we would add a new fact table for shipments, but reuse as much as possible the existing dimension tables
  • Leads to a “collection of stars” … a constellation schema

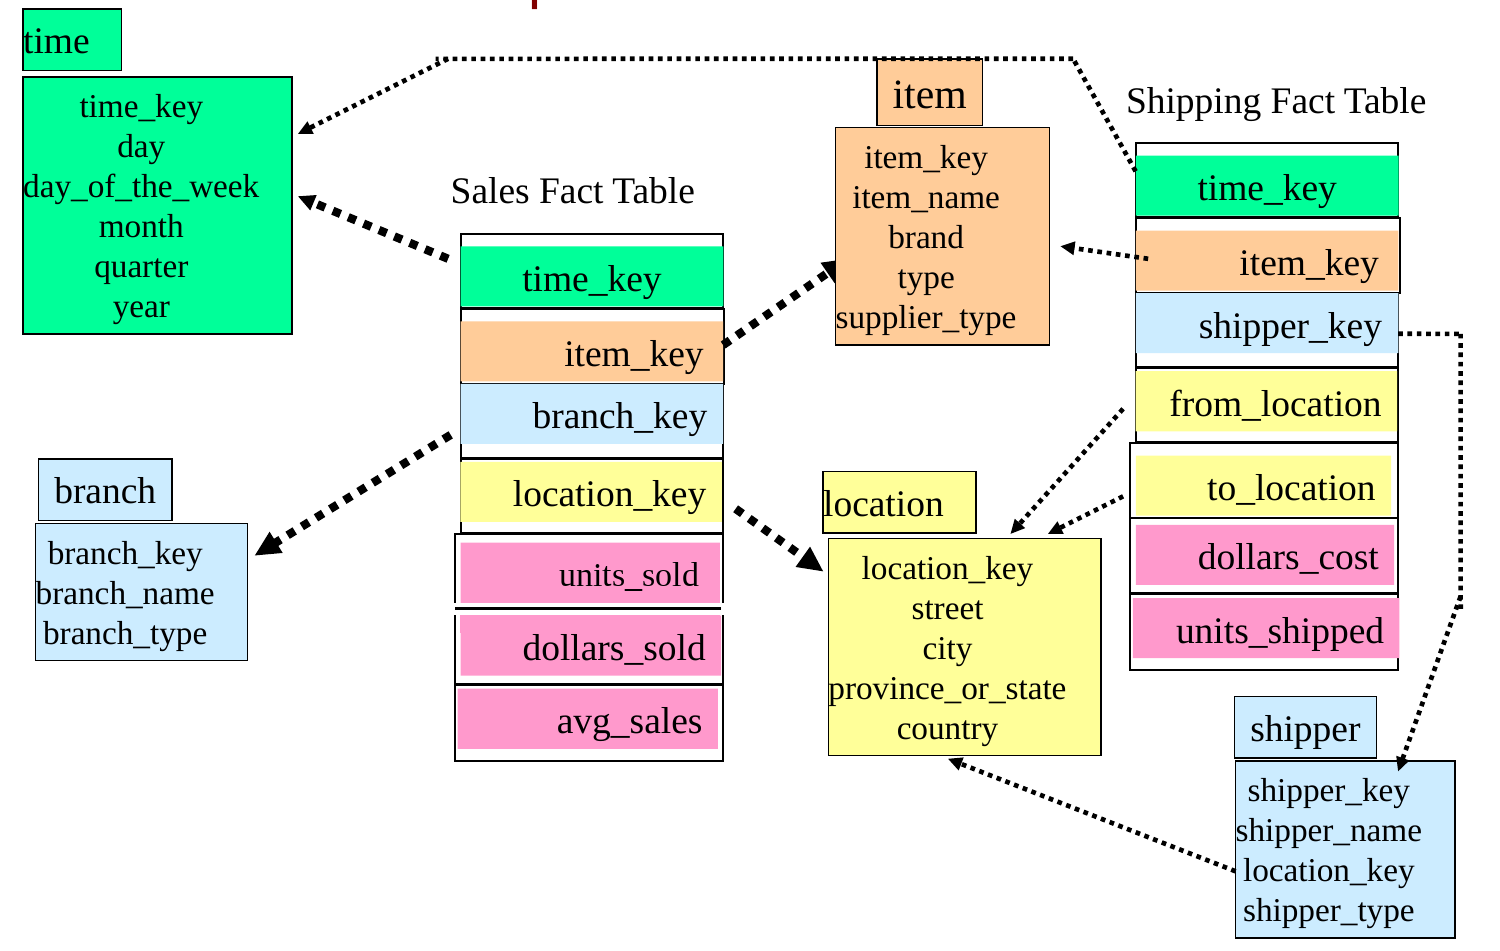
Example of a Fact Constellation

  • New fact table with measures dollars_cost, units_shipped
  • Sharing some dimensions with Sales, but also has a new dimension (shipper)

Measures: Three Categories

  • distributive: if the result derived by applying the function to n aggregate values is the same as that derived by applying the function on all the data without partitioning.
    • E.g., count(), sum(), min(), max()
    • Sum(aggregate) = sum (sum(subaggregate1), sum(subaggregate2)…)
  • algebraic: if it can be computed by an algebraic function with M arguments (where M is a bounded integer), each of which is obtained by applying a distributive aggregate function.
    • E.g., avg(), standard_deviation().
    • E.g. avg() = sum() / count()
  • holistic: if there is no constant bound on the storage size needed to describe a subaggregate.
    • E.g., median(), mode(), rank()
    • E.g, median of aggregate cannot be computed from medians of subaggregates

Aggregate Functions on Measures: Three Categories

  • Given a table: Sales(itemid, timeid, quantity)
  • Target: compute an aggregate on quantity
  • distributive:
    • To compute sum(quantity) we can first compute sum(quantity) for each item and then add these numbers.
  • algebraic:
    • To compute avg(quantity) we can first compute sum(quantity) and count(quantity) and then divide these numbers.
  • holistic:
    • To compute median(quantity) we can use neither median(quantity) for each item nor any combination of distributive functions.
    • Has to be computed separately for each aggregation

A 3D Data Cube and its Cuboids

  • The set of cuboids forms a lattice
  • The lattice is a graph showing relationships between cuboids
  • Moving on the lattice corresponds to aggregation or disaggregation